Monitoring
The monitoring feature can be accessed via the Index page of the Q-Net V7 Pro server. It aggregates live data based on the actual usage of the queue management system. The out of the box view contains a holistic overview of data to have a better grasp of the utilization of the entire service, including the live tickets being processed, the statuses of the clerks, statistical distribution of the services being chosen and an hourly ticket request view.
The monitoring view enables the user to manage the ongoing tickets in real time, including redirecting them, changing their priority, moving them to waiting lists and so on.
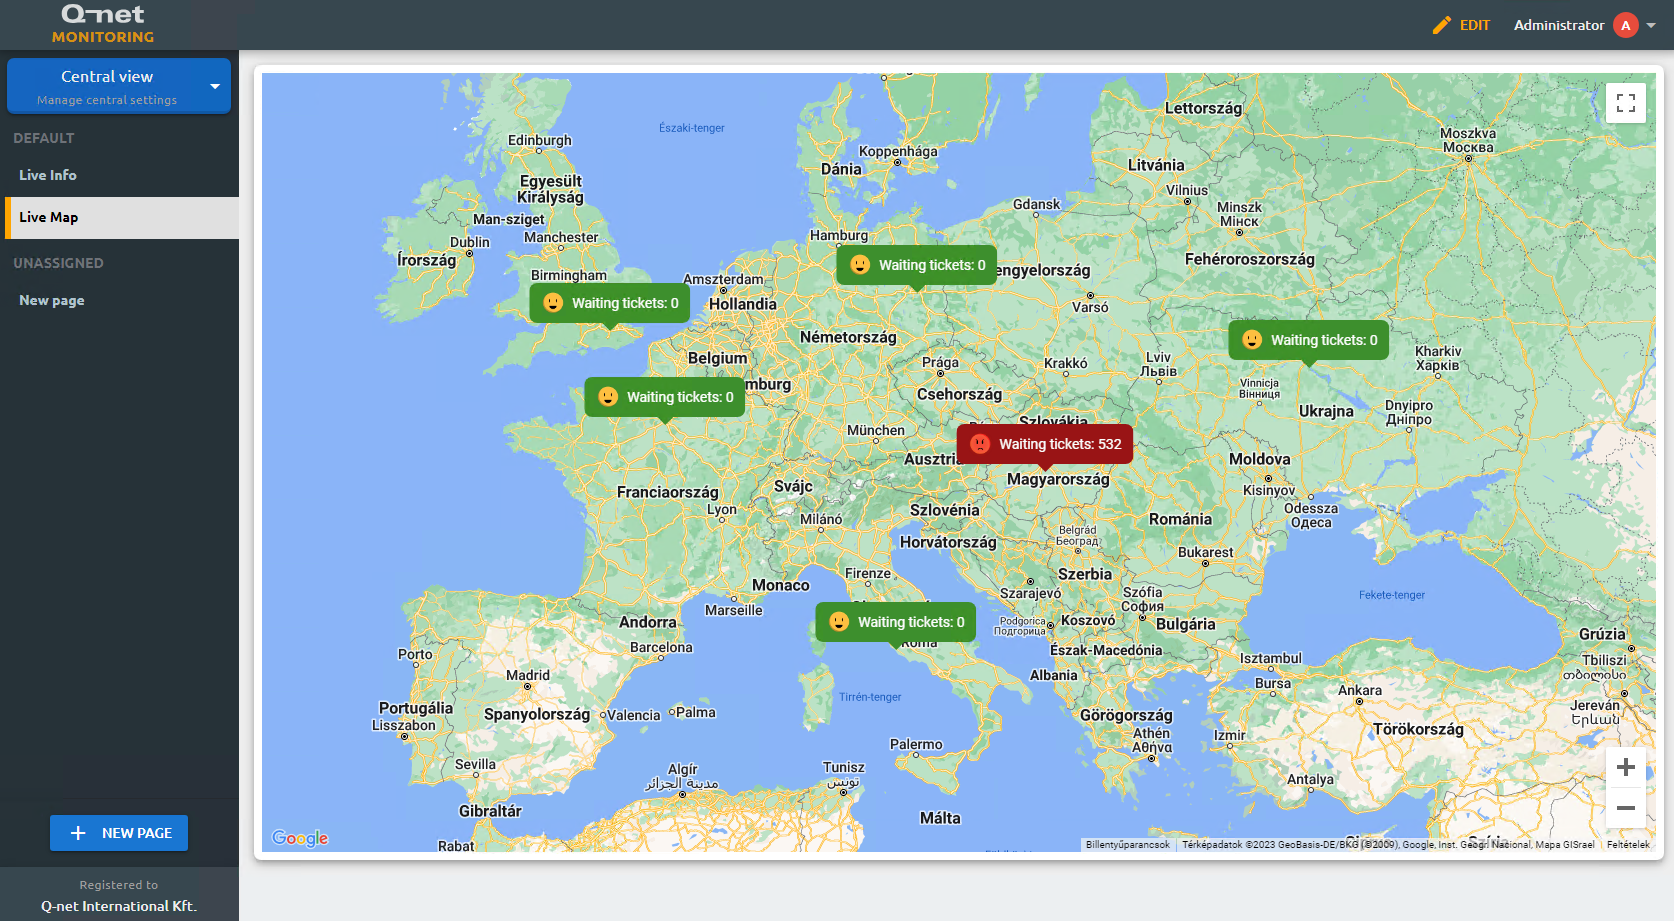
Live Map
On a multiple branch configuration, the Live Map view can provide a quickest overview based on the real-time data of the busyness of each branch. The locations are based on the branch GPS coordinates, which can be set on the Others page of the Branches view in the general settings. The Live Map requires a Google Maps API key, which you may provide on the Map Settings tab, located in the External systems settings. More information about how to generate Google Maps API keys can be found here.

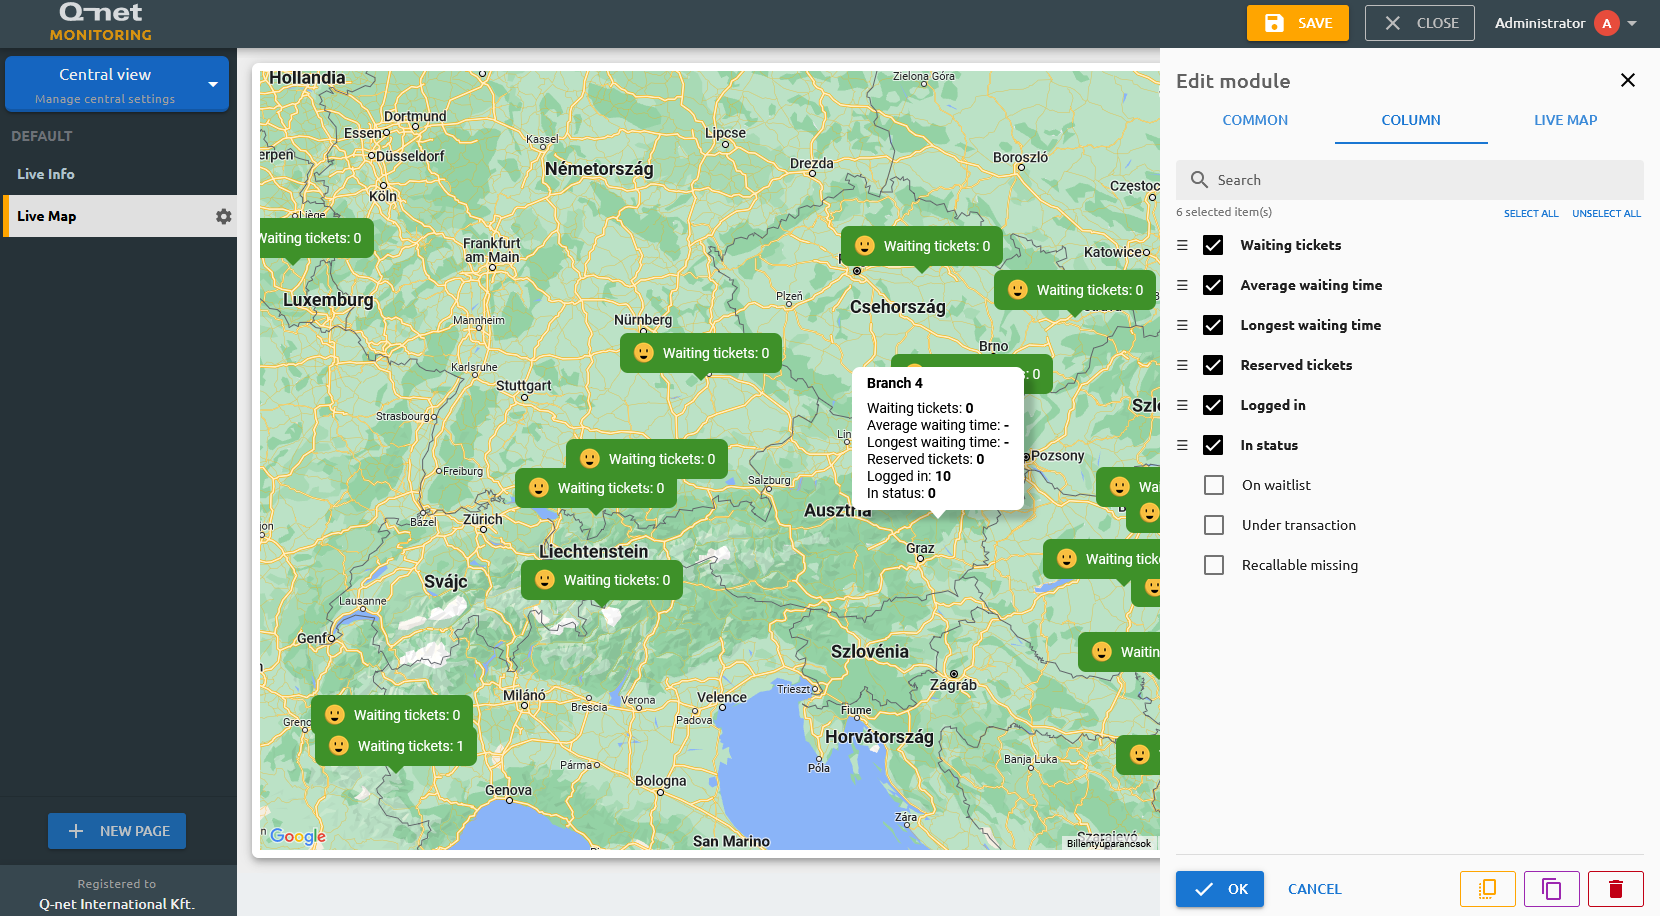
You can customize the information displayed on the Live Map further, by entering Edit Mode (by clicking on the Edit button in the top right corner), and then clicking on the Gear icon. By clicking on the location's pinned data, you can retrieve live monitoring data about that location. In the Edit Mode you can select up to 9 different metrics on the Column tab, that will be shown on the Live Map, including ticket statuses, waiting information and so on. The Live Map tab enables to edit further parameters, including the thresholds of the warning and error levels (which affects the smiley associated with the location).
Live Info
The Live Info view is the main dashboard where you can review the key metrics. By entering Edit Mode, click on the "+" sign to add any pre-configured views to the dashboard. Each of these items are customizable by adding them to the dashboard and clicking on their respective Gear icon. You can move and resize the items while being in the Edit Mode, furthermore, you can specify certain limits, that will add a color to the respective metric, making it easier to catch for the eye if there would be any threshold violation.
