Statistics
The statistics are aggregated data gathered from the Q-Net Pro V7 queue management system, which can be customized based on particular needs. These statistical reports form a comprehensive toolset for analyzing customer flow, service efficiency, and operational performance in queue management environments. Regular monitoring and interpretation support proactive decision-making, leading to improved customer experience and optimized resource allocation.
To customize the dashboard, enter the Edit mode by pressing the Edit button in the top right corner.
Each dashboard element can be customized with the desired set of data, and there are plenty output variations, in which the data can be displayed.
Statistics Report Menu Descriptions
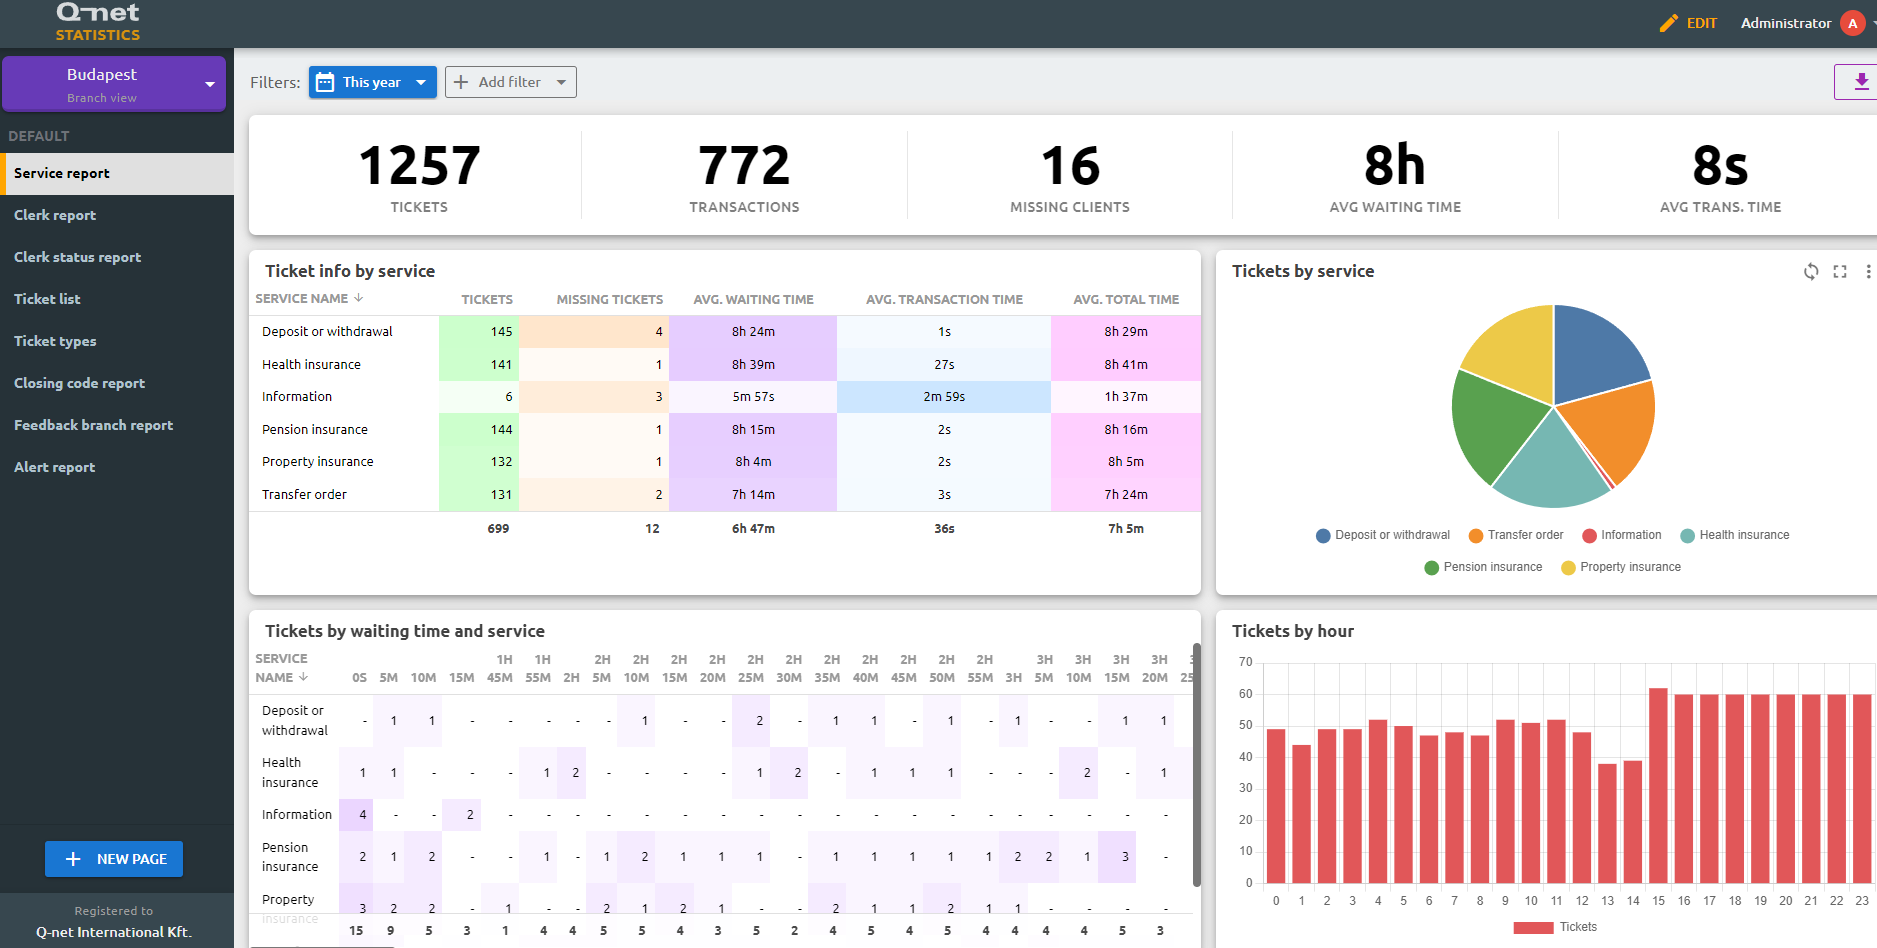
Service Report
This report provides detailed statistics related to individual services offered within a branch or across multiple branches. It shows performance indicators like the number of tickets issued, service times, average waiting times, and service durations for each service type.
Clerk Report
This report provides transaction-level statistics for each clerk (service agent). It includes metrics such as:
- Number of transactions handled
- Average waiting times for customers
- Average service times
- Logged-in times and productive working times
The Clerk Report is essential for evaluating workload distribution and individual agent efficiency.
Clerk Status Report
This report details the time each clerk (service agent) spends in various freely configurable statuses, such as post-processing, lunch break, or other custom statuses. It helps monitor staff availability and non-service-related time usage.
Ticket List
The Ticket List report shows detailed information about all issued and closed tickets within a selected time interval. Details include: Ticket number, Language of service, Waiting time, Service time, etc.
Additionally, selecting an individual ticket reveals all associated events, customer feedback, and any available audio recordings of the transaction for review purposes.
Branch Report
The Branch Report gives an overview of statistical data aggregated at the branch level. It includes general performance metrics like the total number of visitors, tickets issued, tickets served, average waiting and service times, and customer flow for each branch.
Region Report
This report aggregates data on a regional level (branch groups), consolidating the performance indicators from multiple branches within the same region. It helps in analyzing regional trends, service levels, and operational efficiency across the area.
Ticket Types
The Ticket Types report presents a comparative chart of closed tickets based on various criteria:
- Language of service: Displays how many tickets were processed in different languages.
- Ticket creation method: Differentiates between tickets issued via ticket dispensers, smart tickets (mobile or web-based), or created manually by the staff.
- Customer identification method: Shows the method used to identify the customer (if any).
- Closing method: Categorizes tickets based on whether they were closed normally or as missing (customer no-show).
Closing Code Report
Provides a breakdown of tickets based on the specific closing codes applied during service completion. This provides detailed reports based on custom criterias.
Feedback Central Report
This report collects and displays feedback received from customers about their service experience. It includes rating averages, number of feedback submissions, and satisfaction levels across different services and branches.
Alert Report
Displays system alerts generated during service operations. It helps in identifying process disruptions, system malfunctions, or predefined threshold violations (such as excessive waiting times).
Appointment Report
Summarizes statistics related to pre-booked appointments. It includes data on appointment bookings, show-up rates, cancellations.
Service Report
This report provides service-specific performance metrics, aggregating data per service type.
Columns and Explanations:
- Service Name: Name of the service (e.g., Information, Payments, Support).
- Number of Tickets: Total tickets issued for this specific service during the selected period.
- Number of Transactions: Number of successfully finished transactions.
- Missing Tickets: Number of tickets where the customer left without being served.
- Avg. waiting time: This one is the sum of all waiting time periods of a ticket from printing until calling it. In case of e.g. redirection, there are more waiting time periods, these are also - calculated. The average is the sum of these calculated waiting times divided by the number of tickets.
- Avg. transaction time: The transaction time is the sum of all recorded time periods from starting the transaction until closing it. In case of more transactions on one ticket, the sum of these transaction times calculated. The average is the sum of these calculated transaction times divided by the number of tickets.
- Avg. total time: The total time is the sum of all recorded time periods from ticket printing until closing the ticket (the last transaction of the ticket). (Waiting time+calling time+transation time+waiting list time+afterwork time). The average is the sum of these calculated total times divided by the number of tickets.
Branch Report
This report provides branch-level aggregated statistics.
Columns and Explanations:
- Branch: Name of the branch or service location.
- Date: Date for which the data applies.
- Tickets: Total number of tickets issued in the branch during the selected period.
- Missing Tickets: Number of customers who left the queue before being served.
- Percentage of Missing Tickets: Percentage of missing tickets compared to all issued tickets.
- Real transactions: The number of transactions closed normally by the clerks.
- Non-Real transactions: The number of cases when the ticket closed "without transaction"
- Percentage of Non-Real transactions: the percentage of cases when the ticket closed "without transaction" compared to all transactions.
- Avg. waiting time: This one is the sum of all waiting time periods of a ticket from printing until calling it. In case of e.g. redirection, there are more waiting time periods, these are also calculated. The average is the sum of these calculated waiting times divided by the number of tickets.
- Avg. transaction time: The transaction time is the sum of all recorded time periods from starting the transaction until closing it. In case of more transactions on one ticket, the sum of these transaction times calculated. The average is the sum of these calculated transaction times divided by the number of tickets.
- Avg. total time: The total time is the sum of all recorded time periods from ticket printing until closing the ticket (the last transaction of the ticket). (Waiting time+calling time+transation time+waiting list time+afterwork time).
- The average is the sum of these calculated total times divided by the number of tickets.
Ticket List
This report lists individual ticket-level data, giving a detailed view of each customer interaction.
Columns and Explanations:
- Print Time Timestamp when the ticket was printed and issued.
- Ticket Number: Printed identifier of the ticket issued to the customer.
- Language: Language of the ticket selected by the client on the ticket dispenser.
- Service name: Selected service of the ticket
- Priority: The priority of the ticket (higher priority called earlier)
- User Full Name: The name of the clerk handled the ticket
- Calling Time: The time period from ticket printing until the (first) call of the ticket.
- Waiting Time: Time elapsed between Print Time and Calling Time.
- Waitlist Time: Time spent on the waiting list
- AW Time: Time spent with afterwork
- Transaction Time: Time spent between Transaction start Time and End Time (duration of the service interaction).
- Total time: The total time is the sum of all recorded time periods from ticket printing until closing the ticketEnd Time Timestamp when the service was marked as completed.
- Creation type: Shows if the ticket had been created on ticket dispenser, "Smart ticket" or generated directly by the clerk.
- Identification: Shows if the customer had been identified by a booked appointment or by CRM system
- Close type: "Normal" if closed by clerk, "System close" if closed by the "Branch close" process (the clerk didn't close the ticket until the end of the day), or "Deleted" if the ticket had been deleted without serving.
- Trans. waiting time; Trans. calling time; Trans. transaction time; Trans. waitlist time; Trans. afterwork time; Trans. total time: If a ticket has multiple transactions, these columns list each transaction separately for those metrics that are described above