Statistics - Monitoring
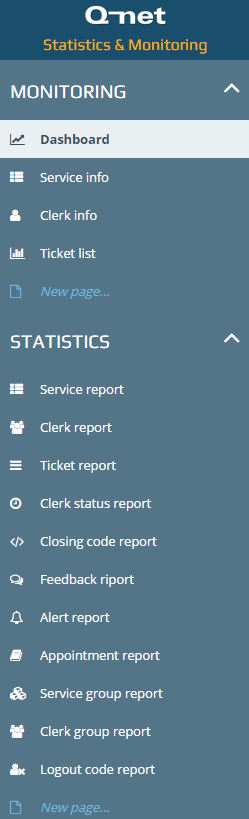
This page will also have a sidebar on the left hand. Those are for selecting the presets of various report types. As you open the page the dashboard will load with live data from all the active branches.
Monitoring
Monitoring mode can be selected on the left bar. All branches mode can show Service info – Clerk info and Ticket list. There is a possibility as well that you can create your personal customized module in every page – or even new page.
Each selection makes an immediate report of the current standings and describes it which you may export in case of external reports require them.
Using the statistics scheduler you can automatize that either.
Exporting can be done with the help of the download sign in every reports top right corner.
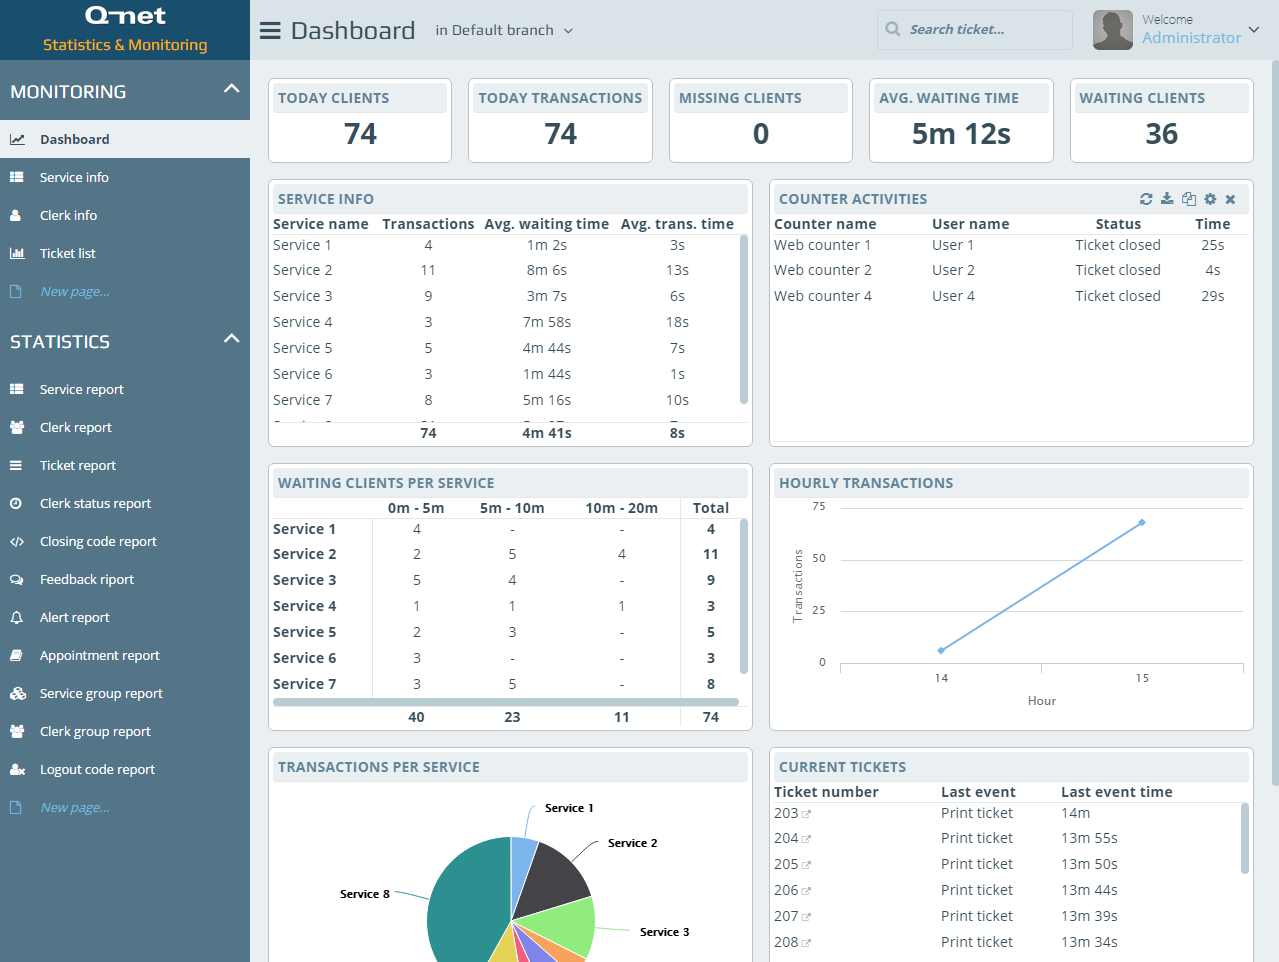
The side menu bar can be expanded with the little arrows besides them. Monitoring mode set to all branches shows the below reports and data:
Dashboard with live data about today’s clients, transactions, waiting time, service info and various reports about counter activities.
Service info is putting the service itself in point of view and shows numbers and graphs from the service selection aspect. Clerk info is similar to the service info – the point of view is the clerk now. Ticket list contains the list of tickets selected by customers in the selected branch. Every ticket can be reviewed with full details on it. There is an option in every page for a New module on the bottom. You can set up fully customized report characteristics in a module.