Statistics - Query Builder
The first step of creating a new module is to enter the Title, the size and the refresh interval. The width property sets the width of an element in percent. The height value means line height. The refresh interval is in seconds. 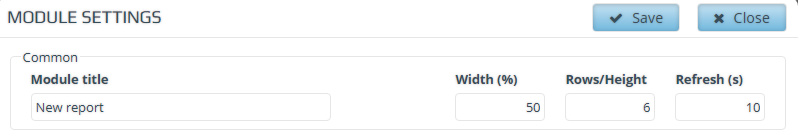
In the next step select the type of the new module. There are 4 available types in the system.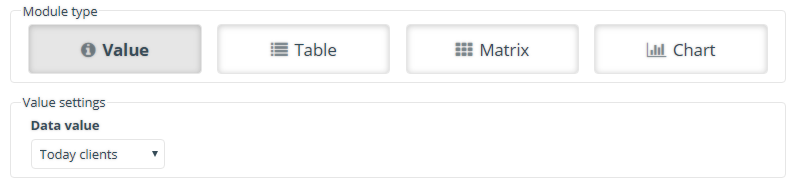
Value
It shows a selected value. The Data value can be selected from the dropdown list. (e.g.: Today clients module from the Dashboard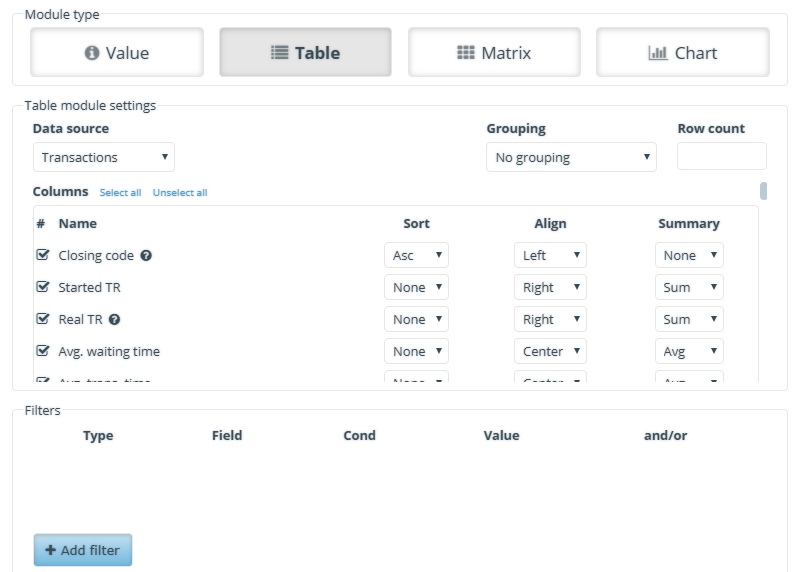
Table
With this option a data table can created. First select a Data source from the dropdown list, then select the Columns that will appear in the module from the list. Multiple columns can be selected. Every column can sorted, aligned and summarized. With the filters more accurate results can be reached.(E.g.: Shows only the details of 1 service or 1 counter)
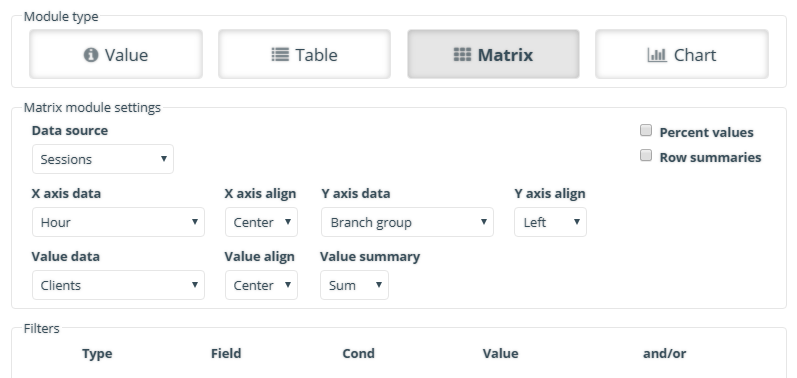
Matrix
Matrix is similar to the Table, but additionally a Value data can be selected to the module. (I.e.: Service report – Client distribution per service per hour)
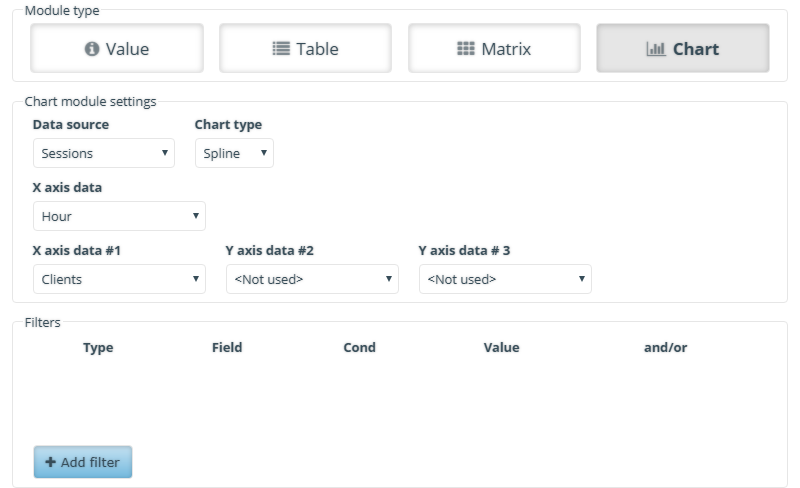
Chart
After selecting a Data source, a Chart type must be selected as well. There are various chart types in the system. (Line, Column, Pie, Spline, Area, Bar) The available data fields depends on the previously selected chart type. (I.e. Service report – Transactions per service)
Occasionally after saving a module a red error message appears next to the module’s name. The reason of this that the selected data quarries can’t be fetched from the database. These quarries must be deleted, since it can cause high system loads.